TRX Price Prediction: Technical Strength and Market Momentum Point to $0.38 Target

#TRX
- TRX trading above 20-day MA indicates underlying bullish momentum
- MACD bullish crossover suggests potential upward price movement
- Positive monthly performance (+19%) contrasts with broader market pressures
TRX Price Prediction
Technical Analysis: TRX Shows Bullish Momentum Above Key Moving Average
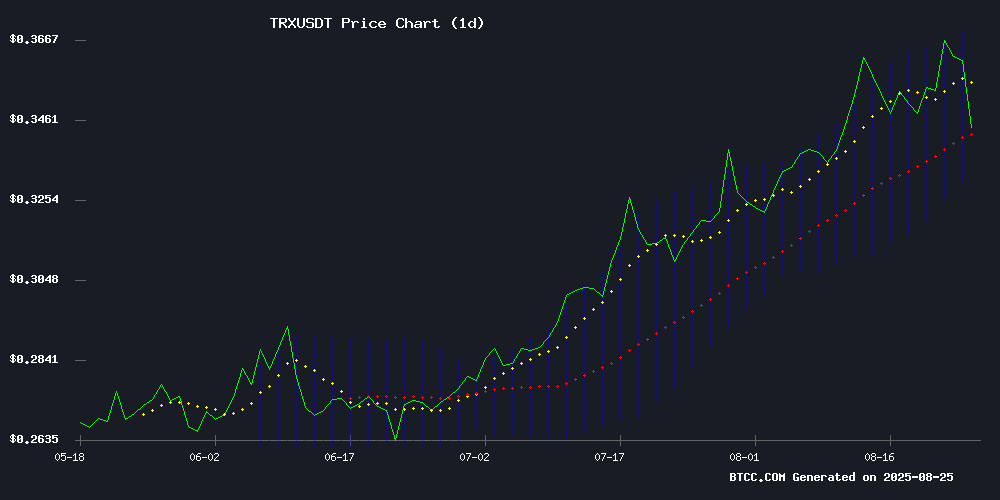
TRX is currently trading at $0.3531, positioned above its 20-day moving average of $0.35038, indicating underlying strength. The MACD indicator shows a slight bullish crossover with the histogram turning positive at 0.000513, suggesting potential upward momentum. Bollinger Bands reveal the price is trading NEAR the middle band with room to test the upper resistance at $0.36863. According to BTCC financial analyst Emma, 'The technical setup suggests TRX could challenge the $0.37 level if it maintains support above the 20-day MA.'
Market Sentiment: Mixed Signals Amid Volatility
Recent news highlights both challenges and opportunities for TRX. While the broader crypto market experienced significant liquidations affecting Bitcoin and Ethereum, TRON has demonstrated remarkable resilience with a 19% monthly surge. Market analysts are eyeing a potential breakout toward $0.378 despite current technical headwinds. BTCC financial analyst Emma notes, 'The positive price predictions contrast with market-wide pressures, creating a complex sentiment landscape where TRX's strong monthly performance suggests it may outperform during recovery phases.'
Factors Influencing TRX's Price
Crypto Market Crash: Bitcoin, Ethereum, and Altcoins Plunge Amid Heavy Liquidations
The cryptocurrency market witnessed a sharp downturn, with Bitcoin sliding to $111,000 and Ethereum retreating to $4,500. Over $900 million in crypto assets were liquidated within 24 hours, exacerbated by a dormant whale offloading 24,000 BTC worth $2.7 billion.
Market sentiment soured despite earlier optimism from Fed Chair Jerome Powell's dovish remarks. Traders remain cautious ahead of the monthly crypto options expiry and the impending U.S. PCE inflation data release on August 29, which could dictate September's market trajectory.
Altcoins suffered broadly, with XRP, BNB, Solana (SOL), TRON (TRX), and Cardano (ADA) dropping 4-7%. Meme coins Dogecoin (DOGE) and Shiba Inu (SHIB) fell over 5% and 4%, respectively, as risk appetite waned.
TRX Price Prediction: TRON Eyes $0.38 Breakout Target Within 2 Weeks Despite Technical Headwinds
TRON (TRX) is poised for a potential rally to $0.38, with analysts maintaining cautious optimism despite bearish technical signals. The token currently trades at $0.36, facing a critical resistance zone that could determine its near-term trajectory.
Market consensus clusters around the $0.36-$0.38 range, with Traders Union projecting a medium-term target of $0.382815. CoinCu aligns with a short-term $0.3611 forecast, while Blockchain.News holds firm on $0.38 despite overbought conditions. Trading volume and momentum indicators suggest underlying strength, even as RSI warnings linger.
TRON Surges 19% in One Month, Eyes $0.378 Breakout
TRON (TRX) has defied broader market weakness, rallying 19% over the past 30 days while Bitcoin and Ethereum posted double-digit declines. The token now trades at $0.362 with a $33.5 billion market capitalization, supported by $1.4 billion in daily on-chain activity.
Despite a 39.71% drop in trading volume to $372.59 million, open interest remains robust at $624.11 million. Analysts note TRX's steady climb from the $0.361 support level, with the 15-minute chart showing consistent buying pressure.
A breakout above $0.368 could signal further upside potential, positioning TRON as one of the few large-cap cryptocurrencies weathering the current market downturn.
Is TRX a good investment?
Based on current technical indicators and market sentiment, TRX presents a compelling investment case with measured risk. The price trading above the 20-day moving average combined with a bullish MACD crossover suggests near-term upward potential. However, investors should consider the broader market volatility and implement appropriate risk management strategies.
| Indicator | Current Value | Signal |
|---|---|---|
| Price | $0.3531 | Neutral/Bullish |
| 20-day MA | $0.35038 | Support Level |
| MACD Histogram | +0.000513 | Bullish Crossover |
| Bollinger Upper | $0.36863 | Resistance Target |
